Posts

Showing posts from 2019

Tips for working with national attendance data

Image
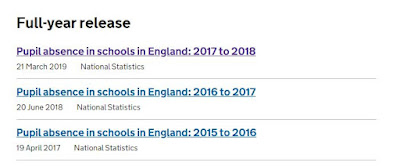
In this post I’m going to talk through some issues I’ve had and tricks come up with when dealing with national attendance stats. The Data First step is to get the data, which you can find at https://www.gov.uk/government/collections/statistics-pupil-absence (or I just google ‘dfe absence statistics’). There are three releases a year. The Autumn term release, which comes out the following May. The Autumn and Spring release which comes out the following October and the full year release which comes out the following March-June. So for the 2018-2019 academic year the autumn term stats were released in May 2019, the Autumn-Spring will be release this month (October 2019) and the full year stats will come out in Spring 2020. You therefore usually have a choice between more recent data that doesn’t cover the whole year and older data that does. Another factor to bear in mind is that the Autumn-Spring data doesn’t have breakdowns for Ever6 FSM where as the full year does. T

Historical Memberships 2

Image
In a previous post I covered how to show historical membership dates, but that referred specifically to the Bromcom MAT Vision dataset, and I’ve since found out a more elegant way of writing the measures, hat tip @JonnySBristol so I’ll recap briefly in the first section of this post, then cover some new techniques in sections 2 and 3. 1 Calculate historical memberships from an enrolments table. My sample data set is structured as a students table with ID, name and gender and an enrolments table with studentid, StartDate and EndDate. This is better than having date of entry/leaving on the students table because it can accurately record a student leaving, then rejoining school. As well as the student and enrolments table we create a DateRef table, via modelling New Table (more details in this in post 1 ). Table from DAX DateRef = CALENDAR(“01/01/2016”,TODAY()) Measures: MaxDate = MAX(DateRef[Date]) MinDate = MIN(DateRef[Date]) We don’t need to relate DateRef (a

Power BI Licensing and Permissions

Image
Building visuals and dashboards is only part of what you need to do before BI can drive any improvement of your school. Once it’s done you need to get those dashboards in front of the people who will turn your data into action. This post explores the various options for publishing and sharing, working from the lowest cost/most restrictive option to more feature rich but expensive paths. Power BI for Free Power BI dashboards are designed using a windows program (Power BI Desktop) then published to a web server which is where you would expect users to interact with them. PBI Desktop is free to download and creates files with the extension pbix. It’s also free to create an individual Power BI account so any user can publish to the secure BI site app.powerbi.com – what they can’t do for free is share dashboards securely (more on that below). If you want a totally secure BI ecosystem without paying anything to Microsoft then you can do that by sharing PBI files but bear in m

Attainment 8 in BI - part 2

Image
Previously on BI4Schools In a previous post we covered how to prepare exam data to work out Attainment 8. Specifically that meant: Adding QANs and ‘EBaccClass’ (EN, MA, EB or OP) Adding DfE Performance Points Duplicating Combined Science records so a record of 65 became two records with points value 5.5 Applying Discounting rules Adding an Index which uniquely identifies each grade ordered from largest to smallest. ·       We brought that data into a BI model with the table name A8Data and linked it to a students table on StudentId. Buckets of Joy We going to create 4 measures, one each for the 4 buckets that make up Attainment 8. We’ll tackle them in order of difficulty: Maths, English, EBacc then Open. Before we get started though I want to do a deep dive on a special class of formulas in DAX – <aggregate>X, specifically SUMX as understanding how that works is key to understanding the measures we need to create. SUMX SUMX has two arguments a