AAB with 2 in Facilitating Subjects
I'm working on KS5 at the moment and an interesting measure from a DAX point of view is AAB with two in facilitating subjects (where facilitating subjects are just a subset of A Levels that the DfE has decided are important)
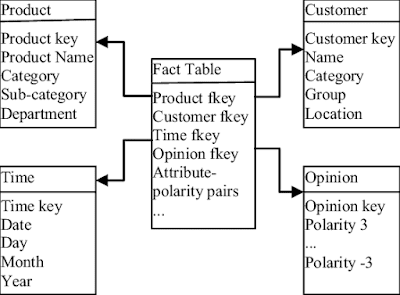
My Data
The data I'm using a really straight up data model with a
students table and a results table. On my results table I have size (in a
levels) a 1/0 flag to say if a result is a facilitating subject and I have a
QualType field that says if it's an A Level, Academic, Applied General or Tech
Level result. This info comes from a spreadsheet DfE publish called
Qualifications counting towards 16 to 18 performance tables.
I merged these together in my data warehouse but if that's not possible I'd recommend doing it in Power Query rather than importing and joining in BI because qualifications are not uniquely identified by QANs so you can't create a one to many relationship. By contrast, if you import the spreadsheet in power query and merge it to your results query using the QAN you can easily add the info. Note that size = Guided Learning Hours / 360.
Cohort
The guidance isn't crystal clear on this point but as best
as I can tell kids count to this measure the first year they are entered for
qualifications of at least 1 A level in size with a total size of at least 2
A-levels (ie two regular A2s or one double A Level). Assuming that's true we
work out what year that is in a calculated column on the students table:
AL_Cohort_Yr =
VAR Entries = FILTER(
ADDCOLUMNS(
SUMMARIZE(RELATEDTABLE(Results),
Results[SeasonYr]),
"Ents",CALCULATE(SUM(Results[Size]),
Results[Discount_Code]<> BLANK(),
Results[Size]>=1)),
[Ents]>=2)
VAR CohortYear = MINX(Entries,Results[SeasonYr])
RETURN
CohortYear
Note that this cohort is different (and smaller) than the
total number of students counting towards Average Points per Entry and Value
Added, so rather than filtering them with a relationship I’m going to get the cohort
number by looking at a year selector I have in a separate table (called SwitchAY)
and using that inside calculate
FacSubCohort =
VAR AY = SELECTEDVALUE(SwitchAY[Year])
VAR C = CALCULATE(COUNTROWS(Students),
Students[AL_Cohort_Yr]
= AY)
RETURN
C
The heat of the meat
So we have a way to work out our denominator now we just need to know the numerator. At its simplest, what a DAX
measure does is reduce the information on a table to a single figure. Therefore
the best approach to a new problem in DAX is to think first, how do I get the
table that contains the information I want, second, what aggregations do I need
to reduce that table to a single point and then third how I will I mess it up
and end up with the wrong result.
I like to start off with parts one and two in my head rather
than trial and error on the screen because I think that helps with the vital
step three. Obviously the table that we’re going to need is the results of the
students, reduced to a Yes/No for each student. Here are the edge cases *that I
thought of* that could potentially throw me and be aware that by no means implies
I thought of them all.
Say you have a kid with two As in non Fac subjects and two Bs
in Fac subjects. They have AAB and they have two Fac subject results but they
don’t have AAB with 2 in Facilitating. To guard against this I decided to
consider only the students’ top three results using TOPN.
There’s a full explanation of TOPN in this post onAttainment 8 but it’s syntax is basically
TOPN(<N - number of records>,<table>,<field
used to sort>,<sort order>)
The really crucial thing to know about TOPN though is that
it doesn’t break ties. So if you did TOPN(3,Results,Points,desc) and you have a
100 A*s with 60 points then you would get a table with 100 results in as all those
results have sufficient points to make it into the top 3. It’s more accurate to
describe it as “TOP however many records qualify as being in the top N”.
Therefore in order for TOPN to be useful you need a unique
index ranking all results by size. I use ROW_NUMBER() to do this in SQL but you
can do it by adding an Index column in Power Query (I call it ResIndex which is
how you’ll see it referred to in the formula below).
A little while after I proudly plugged this into BI I
thought of another plausible edge case that could cause an inaccuracy – say you
have a kid who has two As (one Fac one no) and two Bs (one Fac one no). Whether
you count him as yes for the measure will depend on whether the facilitating subject
B is included in his top 3. Therefore when sorting the results to determine the
ResIndex you should sort by Points descending then by FacSub descending (assuming
that 1 denotes a FacSub and 0 a non FacSub).
Once you can be sure that you have a student’s best three
results and FacSubs are prioritised over non fac subs you need to determine which
aggregations prove AAB with 2 fac subs have been achieved. I think you need
three for this – sum of FacSub, sum of Points and min of points (because A*,A,C
has the right total but not the right grades).
For the final measure I use CALCULATETABLE to get a table of
the students in the measure for the selected year.
I then use ADDCOLUMNS to add to this table the three
aggregations of the results table I need to know whether they qualify or not. Next
I run SUMX over this table variable checking these three aggregations then
finally divide the total by the number of rows in the students table (ie the cohort).
AAB with two Facilitating =
VAR AY = SELECTEDVALUE(SwitchAY[Year])
VAR Stds = CALCULATETABLE(Students,
Students[AL_Cohort_Yr]
= AY)
VAR AABFtbl = ADDCOLUMNS(Stds,
"FS",CALCULATE(SUMX(
TOPN(3,
RELATEDTABLE(Results),
Results[ResIndex]),
Results[FacSub])),
"MinPts",CALCULATE(MINX(
TOPN(3,
RELATEDTABLE(Results),
Results[ResIndex]),
Results[Points])),
"TotPts",CALCULATE(SUMX(
TOPN(3,
RELATEDTABLE(Results),
Results[ResIndex]),
Results[Points])))
VAR AABF = SUMX(AABFtbl,SWITCH(TRUE(),
[FS]<2,0,
[MinPts]<40,0,
[TotPts]<140,0,
1))
VAR Cohort = COUNTROWS(Stds)
RETURN
Further Explanation and Context Transition
To go through the formulas in the added columns (working from the inside out):
RELATEDTABLE is used to bring related records from the many side of a one to many relationship (as opposed to RELATED which brings a scalar value from the one side).
TOPN gets the top 3 results. Because the order is determined by the ResIndex which uniquely ranks every result it is guaranteed to return a maximum of 3 records.
SUMX iterates through those three or fewer records adding the values of Points or FacSub
MINX iterates through the three records and returns the lowest value of Points.
CALCULATE - I think it may be superfluous here and the formula should work without it (but I'm not 100% because it works as is so I didn't bother to check).
The reason why I, out of habit, included CALCULATE here is interesting - nearly always when using ADDCOLUMNS you use calculate to perform what's called context transition, which is where row context is transitioned into filter context.
Say you have the formula:
ADDCOLUMNS (
SUMMARIZE(Results, SchoolStudentID),
"Points", SUM(Results[Points]))
SUMMARIZE creates a table with one row per student and when you use ADDCOLUMNS the columns you add have row context (just like when you add a calculated column to a table). But aggregations like SUM, COUNT etc aren't affected by row context - so the formula above will sum the points of all the records of Results in the filter context, not just the points of that row's particular student.
If you change the last expression to CALCULATE(SUM(Results[Points]))) then context transition occurs, translating the row context (ie which kid we're talking about) into filter context. That makes the formula return the sum of the points of the right student which is far more useful.
Comments
Post a Comment