Posts

AAB with 2 in Facilitating Subjects

  I'm working on KS5 at the moment and an interesting measure from a DAX point of view is AAB with two in facilitating subjects (where facilitating subjects are just a subset of A Levels that the DfE has decided are important) My Data The data I'm using a really straight up data model with a students table and a results table. On my results table I have size (in a levels) a 1/0 flag to say if a result is a facilitating subject and I have a QualType field that says if it's an A Level, Academic, Applied General or Tech Level result. This info comes from a spreadsheet DfE publish called Qualifications counting towards 16 to 18 performance tables. I merged these together in my data warehouse but if that's not possible I'd recommend doing it in Power Query rather than importing and joining in BI because qualifications are not uniquely identified by QANs so you can't create a one to many relationship. By contrast, if you import the spreadsheet in power query and

SQL - P8 estimates from the right year or latest available

This is the first of a few little posts I'll be doing on SQL as it seems like a fair few of you use it in complement with power BI. I'll be assuming a basic knowledge of SQL so familiarity with SELECT, UPDATE and DELETE statements, subqueries and inner and out joins. If you need to get up to speed with the basics of SQL there are free courses on udacity and a good syntax reference at https://www.w3schools.com/sql/ To kick us off let's consider a problem about Progress 8 estimates on a table with 3 columns, KS2, Estimate and SeasonYr : if they exist for the year of the results then I want to use the ones from the appropriate year, but I can't just join on year because my latest estimates are from 2019 but I have actual results from 2020. So I want to use the right year if it's there and the latest available if not. The first step is to create a view with the latest estimates, which you can do by joining the table to a subquery finding the latest year Create vi

Data modelling for a large MAT

Image
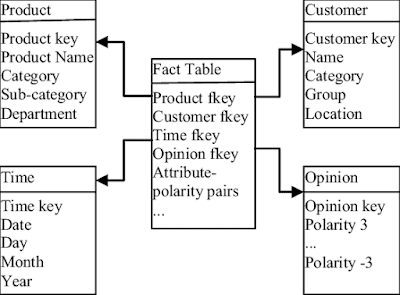
The wrong way When I first started developing in BI I worked on single schools and MAT demo systems with tiny numbers of students so my approach to data modelling was chuck data in however it comes then play with relationships until the configuration works. When I switched to developing for a large MAT (c40k kids in 50 schools) I found out the hard way the limitations of this approach-my measures and reports were unusably slow.  As well as the sheer volume of data I had problems because the MAT wanted a report on pupil demographics, attendance and exclusions with historical accuracy- ie not only seeing data for who's FSM, PP etc today but for any point/period in the past as well. This divides your pupil contextual factors into two types; unchanging, like ethnicity, EAL & KS2 prior attainment that don't change and so can stay on the students table, and changeable, like Pupil Premium eligibility, that can vary depending on the date range you're looking at.  My original

Nan, Infinity and the healing power of DIVIDE

This is a little post about a really simple change that I've found really helpful concerning tables/matrixes showing NaN and Infinity. What's up with this? This happens when you have a measure that equates to <a number> / nothing If your nothing is the number zero then BI shows infinity. More commonly though your nothing is...nothing. BLANK() in terms of DAX (null in SQL). That's when you get NaN which stands for Not a Number. Note that if your denominator is COUNTROWS and there are no rows in the filter context then DAX returns BLANK not 0. Solution The simple solution is to use the DIVIDE function which takes the numerator and denominator as its first two arguments. If the denominator is blank then by default it returns BLANK() (So crucially won't force a row to appear in a table). You can also add a third argument with an alternate result if the numerator can't be divided by the denominator. So now you don't find / in my measure code because DIVIDE is b

Covid-19 Monitoring

Image
In an earlier post   I explained how to get Covid-19 data from the Public Health England API. You can download my data monitor PBI filehere but you should refer to that post to explain how to create queries to get the specific local authority data you need for your school. What data is there and how should we monitor it? The PHE data has different indicators for different area types (they’re also subject to change so check here  for the latest info). At local authority level you can get new cases, cumulative cases (which is all since the outbreak began, not all currently ill) and cumulative cases per 100k of population. I think cumulative cases is irrelevant so I’m monitoring new cases in the past 7 days. Cumulative case rate is also irrelevant but useful for calculating the borough population. My tracker also monitors hospitalisation and death figures although these are only available at the national not the local authority or regional level. There obviously isn’t a clear d

Get Covid19 Data from the Public Health England API

Image
Monitoring the spread of corona virus will be an additional challenge for educators this autumn on top of the usual challenges of making a successful start to the academic year. This post explains how to get Covid19 data from Public Health England (PHE) into BI via Power Query. In subsequent posts I’ll talk about what you can do with it in BI. If you know of other sources of Covid19 data (with a publicly accessible API) please let me know. The Data Source PHE publish data for six area types, overview (whole UK), nation (England, Scotland, Wales and Northern Ireland), Region, NHSRegion, Upper Tier Local Authority and Lower Tier Local Authority. I haven’t quite worked out the difference between Upper and Lower LA but Lower Tier seems to correspond with London Borough/Local Education Authority and is the most granular so that’s the level I’ll be focusing on. (There is a map here https://www.arcgis.com/apps/webappviewer/index.html?id=47574f7a6e454dc6a42c5f6912ed7076 with smaller area

Using BLANK() to Filter Tables and Matrices

Image
I've recently changed my approach to filtering table and matrix visuals and it's led to big performance improvements in the load times of these visuals so I want to share it with you guys. Basically what I've done is stopped in nearly all cases using measures to filter visuals and instead started writing my measures so that they return BLANK() instead of a result I want to filter out. I'm going to explain a bit about BLANK() first, then I'll give an example of how this works. Blank as a concept If you have a background with other database programs you'll probably be familiar with the idea that null - the absence of a result - is different from 0 or "" (an empty string). If you're background is mostly Excel then you should be aware that BI treats null (no value in a column) differently from "" which would denote a string with length 0. We don't need to go deep into the weeds about why this is and how null is treated in every case,