Benchmarking against National Data
One of the features I was really pleased to add to Bromcom Analytics in BI was the ability to choose between various attendance and KS4 Performance benchmarks from national data. DfE publication is still a little scattergun (although it has vastly improved in the last couple of years) and if you hunt around a bit you can find national, local authority and school level performance at KS4, absence and persistent absence rates and Ofsted ratings. I've collated this data into a sheet you can download here. Be aware that it's 2016-17 data though as that was the latest available when I made it.
My aim was to produce a drop down selector that allows the user to place a target indicator alongside their performance.


Put National Data in the Cloud
To do this, I first uploaded my national data set to Google and converted it into a Google Sheet. Now as it's static data you might be wondering why not simply import it into BI? The reason is when you go to schedule refresh of your dashboard on the BI service, with static datasets you need to install a Power BI Gateway (even if those datasets are set to not automatically refresh in PBI desktop). It's an option but personally I think it's more hassle than hosting online.
There's a little bit of wrangling to do once your spreadsheet is a google sheet though. First Share it to get a shareable link.

Your link will look like this:
https://docs.google.com/spreadsheets/d/1qbEJU_gbBvSEsO6DorxXE0eEc1_09jGBvdHI418lmqQ/edit?usp=sharing
Paste that into Notepad, we need to mess around with it a bit before it goes into BI. The string between d/ and /edit is the unique ID of the sheet, which I'll call the <UID>
In notepad replace "/edit?usp=sharing" with "/export?format=xlsx&id=" then add the <UID> at the end. So my link would become:
https://docs.google.com/spreadsheets/d/1qbEJU_gbBvSEsO6DorxXE0eEc1_09jGBvdHI418lmqQ/export?format=xlsx&id=1qbEJU_gbBvSEsO6DorxXE0eEc1_09jGBvdHI418lmqQ
Then in BI select 'Web' from the Get Data dropdown and paste in the link.
Summarising the Data with DAX
Now that our national data is in BI we want to summarise it to give us averages for different Ofsted grades and school types. To do this click 'New Table' on the Modelling tab. The basis for this (and other) tables we're making here is the SUMMARIZE formula that has the syntax SUMMARIZE(<table to work in>,<column with group by values>, <column name1>,<summary expression1>,<column name2>,<summary expression2>....)
My Ofsted Rating table looks like this:
KPIOFS = SUMMARIZE(NationalData2017,NationalData2017[Overall effectiveness],"KS2APS",average(NationalData2017[KS2APS])/6,"9-4",average(NationalData2017[PTL2BASICS_94]),"9-5",average(NationalData2017[PTL2BASICS_95]),"EBACC",0,"Attainment8",SUM(NationalData2017[TOTATT8])/SUM(NationalData2017[TPUP]),"Progress8",average(NationalData2017[P8MEA]),"TPUP",AVERAGE(NationalData2017[TPUP]))
What this formula is doing is exactly what the Table visual does in BI. The difference is that the data in our table is available for use in other visuals.
(EBacc is '0' because I want space in the table for EBacc APS but there's no historical data)
The Overall Effectiveness column has values 1 to 4. So I added a calculated column giving the values I want to present to the user:
Benchmark = SWITCH(KPIOFS[Overall effectiveness],1,"Ofsted: Outstanding",2,"Ofsted: Good",3,"Ofsted: Requires Improvement",4,"Ofsted: Special Measures","Ofsted Ungraded")
Different Tables, same Columns
Obviously you don't get overall national data by averaging individual school performance, they're published separately. But you want to arrange and import them so that they have exactly the same columns in the same order. Once you have a series of tables beginning KPI... that have data broken down by LA, Ofsted, overall national (and each with a Benchmark column, clearly saying what the row refers to) you need to combine them into a single table.
This is simple, create a table with DAX and use the UNION function to simply list the tables you want to join.
KPIUnion = union(KPIOFS,filter(KPISchType,KPISchType[MINORGROUP]<>blank()),KPILA,OverallNational)
Note the optional filter to remove blank rows from table KPISchType
Be aware when using UNION that all it's doing is stacking tables on top of each other without any clever data checking/matching. That's why it's important to make sure all your constituent tables have the same columns in the same order.
My aim was to produce a drop down selector that allows the user to place a target indicator alongside their performance.
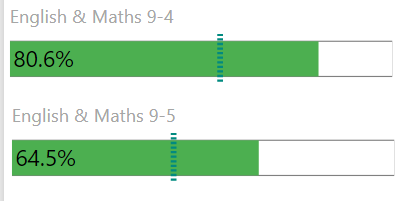
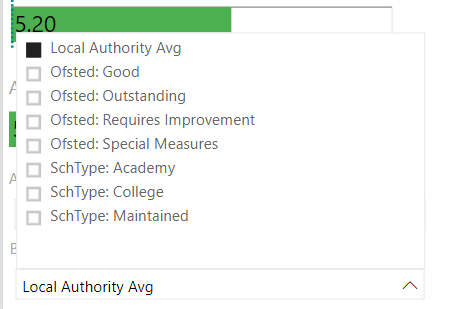
Green dotted lines show the selected benchmark. The Visual is from the BI Marketplace and called 'Data Bar KPI'
Put National Data in the Cloud
To do this, I first uploaded my national data set to Google and converted it into a Google Sheet. Now as it's static data you might be wondering why not simply import it into BI? The reason is when you go to schedule refresh of your dashboard on the BI service, with static datasets you need to install a Power BI Gateway (even if those datasets are set to not automatically refresh in PBI desktop). It's an option but personally I think it's more hassle than hosting online.
There's a little bit of wrangling to do once your spreadsheet is a google sheet though. First Share it to get a shareable link.

Your link will look like this:
https://docs.google.com/spreadsheets/d/1qbEJU_gbBvSEsO6DorxXE0eEc1_09jGBvdHI418lmqQ/edit?usp=sharing
Paste that into Notepad, we need to mess around with it a bit before it goes into BI. The string between d/ and /edit is the unique ID of the sheet, which I'll call the <UID>
In notepad replace "/edit?usp=sharing" with "/export?format=xlsx&id=" then add the <UID> at the end. So my link would become:
https://docs.google.com/spreadsheets/d/1qbEJU_gbBvSEsO6DorxXE0eEc1_09jGBvdHI418lmqQ/export?format=xlsx&id=1qbEJU_gbBvSEsO6DorxXE0eEc1_09jGBvdHI418lmqQ
Then in BI select 'Web' from the Get Data dropdown and paste in the link.
Summarising the Data with DAX
Now that our national data is in BI we want to summarise it to give us averages for different Ofsted grades and school types. To do this click 'New Table' on the Modelling tab. The basis for this (and other) tables we're making here is the SUMMARIZE formula that has the syntax SUMMARIZE(<table to work in>,<column with group by values>, <column name1>,<summary expression1>,<column name2>,<summary expression2>....)
My Ofsted Rating table looks like this:
KPIOFS = SUMMARIZE(NationalData2017,NationalData2017[Overall effectiveness],"KS2APS",average(NationalData2017[KS2APS])/6,"9-4",average(NationalData2017[PTL2BASICS_94]),"9-5",average(NationalData2017[PTL2BASICS_95]),"EBACC",0,"Attainment8",SUM(NationalData2017[TOTATT8])/SUM(NationalData2017[TPUP]),"Progress8",average(NationalData2017[P8MEA]),"TPUP",AVERAGE(NationalData2017[TPUP]))
What this formula is doing is exactly what the Table visual does in BI. The difference is that the data in our table is available for use in other visuals.
(EBacc is '0' because I want space in the table for EBacc APS but there's no historical data)
The Overall Effectiveness column has values 1 to 4. So I added a calculated column giving the values I want to present to the user:
Benchmark = SWITCH(KPIOFS[Overall effectiveness],1,"Ofsted: Outstanding",2,"Ofsted: Good",3,"Ofsted: Requires Improvement",4,"Ofsted: Special Measures","Ofsted Ungraded")
Different Tables, same Columns
Obviously you don't get overall national data by averaging individual school performance, they're published separately. But you want to arrange and import them so that they have exactly the same columns in the same order. Once you have a series of tables beginning KPI... that have data broken down by LA, Ofsted, overall national (and each with a Benchmark column, clearly saying what the row refers to) you need to combine them into a single table.
This is simple, create a table with DAX and use the UNION function to simply list the tables you want to join.
KPIUnion = union(KPIOFS,filter(KPISchType,KPISchType[MINORGROUP]<>blank()),KPILA,OverallNational)
Note the optional filter to remove blank rows from table KPISchType
Be aware when using UNION that all it's doing is stacking tables on top of each other without any clever data checking/matching. That's why it's important to make sure all your constituent tables have the same columns in the same order.

Comments
Post a Comment