Attainment 8 in BI - Part 1
It’s been bugging me for a while that I didn’t know how to
calculate A8 in BI, even though as a mostly Bromcom user it wasn’t a big deal as
you can get the figures straight out of the MIS. That said, it was interesting
solving all the steps along the way and even if you do get these figures out of
your MIS or an Excel broadsheet I think you’ll find the exercise useful for
building your BI skills.
Source Data
I’m going to assume source data in the form of a table of
exam results with a student identifier, season, result date, exam code and
result. You can download my source data and/or the PBIX file. In a BI4Schools first we’re not
going to import this data as is though, as we’ll be amending it using Power
Query. Power Query (PQ) is the set of tools BI uses to get and manipulate data
before placing it as a table in the BI model. PQ uses a language called M to do
this – note that it is different to DAX, the language used within the BI model.
To open Power Query click ‘Edit Queries’ from the Home Ribbon, or click ‘Edit’
when defining a data source.

I’m using another source table called ‘XCodes’ which lists
my subjects, exam code, QAN number and ‘EbaccClass’ stating which A8 ‘Bucket’
they belong in (EN, MA, EB or OP). You could look this classification up from
the DFE’s EBacc Qualifying subject data, but unless you’re dealing with a
very large data set it’s not worth it. For a school or MAT user it will be
easiest to go down the list of subjects and put them into the appropriate
category by hand. Some EN and EB results can count in the OP bucket of course,
but we’ll cross that bridge when we come to it.
Finally, I’m using two DfE files, KS4 Qualifications and
Discount Codes and KS4 Qualifications and Points scores. Below I’ll explain how
to get this data (more or less) directly from the DfE website but for the
sample pbix file I’ve copied it into my source data so this post won’t break if
the DfE changes or moves it.
Import Data
Start by bringing the basic data into BI. For me that’s a
simple Students table, ExamData with my individual exam results and XCodes
which is where I link my Exam Codes to QANs and EBacc Class. We’re now going to
change the ExamData table in Power Query, which we open by clicking ‘Edit
Queries’ on the Home Ribbon.
You might get errors when you bring in your Exam Data
caused by the fact that BI will look at the first few rows of data to determine
data types so might conclude that Exam Grade is numerical – it will then treat
any A*-G or BTEC Grades as errors. If this happens right click on the column in PQ and change type to text. You can then delete the group of query errors from the
list on the left.
<
 Merge XCode Data
The first step is look up the QAN and EBacc Class. PQ calls
this merging the tables. Select ExamData then click Merge Queries

Select the table with the data you want to merge into the
ExamData Table (XCodes in the sample set). Then click the field that is used to
match the records in both tables (ExamCode). The default join type, Left Outer
is what we want so leave as is, but note that other options are available.
Click OK.

Now use the expand arrow to expand the merged table and
pick the fields you want. For me that’s QAN and EBaccClass.

Combined Science
My Source Data has combined science as one row with a
double grade (e.g. “45”). Depending on the performance measure combined science
sometimes counts as two grades and sometimes one. For A8 it’s two grades each
with the mean value of the double grade. So a “45” counts as two grades with
value 4.5.
We’re therefore going to create duplicate rows for combined
science, but with an indicator that will allow us to filter out the duplicates later
if necessary. To do this go to the Add Column Ribbon and add a conditional
column. Change its name to ‘Duplicate’ and add the condition that if the exam
code is that of combined science, 1 else 0.

Now go back the Home Ribbon and click on the Advanced
Editor. Change the line
#"Added Conditional Column" =
Table.AddColumn(#"Expanded XCodes", "Duplicate", each if
[ExamCode] = "Co189" then 1 else 0)
To
#"Added Conditional Column" =
Table.AddColumn(#"Expanded XCodes", "Duplicate", each if
[ExamCode] = "Co189" then "0,1" else "0")

Now, with the new Duplicate column selected, choose ‘Split
Columns, by delimiter’ from the Home Ribbon. The comma is the delimiter.
Expand the advanced options and choose to split into rows.
This will turn every Combined Science record into two rows, one where the
Duplicate column has a value of 0 and one where it has a value of 1.


Adding Performance Points
We now need to add the points value of each grade to the
dataset. We can look this up on a handy spreadsheet the DfE publish called “Performancepoints for qualifications counting in the 2019 key stage 4 performance tables.xlsx”.
In my sample I’ve copied this data into my file as the tab ‘Underlying Data’,
but it’s better to read it from its web source rather than excel import because
you can’t set up scheduled refresh for a BI report that gets data from a local
hard drive.
To do this, download the file from the site, then open up
your browser’s downloads page (ctrl + J in Chrome) and right click to copy the
link address.


Now in PQ click the New Source menu in the Home Ribbon,
select Web and paste the link address. Choose the table ‘Underlying Data’ and
click OK. Because it’s from the DfE there’s now some pointless nonsense to
correct. Click on Remove Rows to remove the top 2 rows. Then click ‘Use First Row
as Headers’.


Now we need to merge again to bring through the points
values. Select Exam Data. For the merge to work we need to compare data of the
same type, so check that QANs are stored as text and if not, right click the
column, choose ‘change type’ and select text.
Now merge the queries as with the XCode data but this time
select QAN and then Ctrl Click Grade (you’ll see a little 1 and 2 appear in the
heading). Then do the same in the Underlying Data table so that matching is by
QAN and Grade. Note that only pass grades are listed in the DfE file, so any Us
in your data won’t be matched – that’s fine they’ll just end up with a null as
the value.


Expand the merged table as before and choose ‘Performance
Points’. Right click the column header and rename it to the more manageable
‘Points’. Check your other column names too any shorten any unwieldy ones.
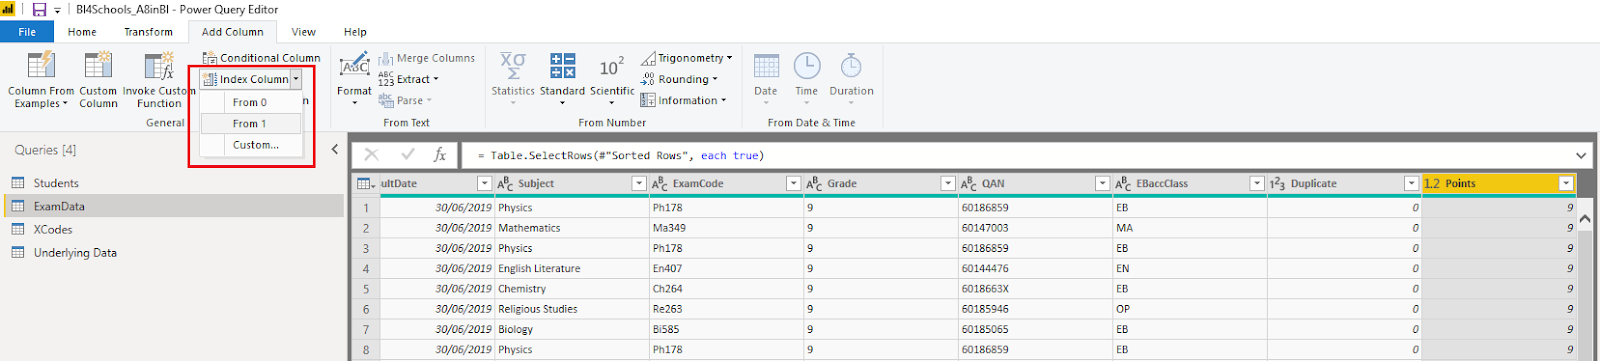
Add an Index
The final task we need to complete in PQ is to add an
index, which will help us determine the top grades in the various A8 buckets.
To do this first sort the table by Points, largest to smallest. You can do this
exactly as you would an Excel table, by clicking the filter arrow and selecting
‘Sort Descending’.
Now go to the Add Column ribbon and add an index from 1.
Each kid’s grades will have non sequential index numbers but that doesn’t
matter – the import fact is that every grade is uniquely identified and that
every grade has a points value greater than or equal to all the grades with a
larger index value.
Here is the full list of PQ steps:

Discounting
Discounting refers to clashes whereby only one of multiple
results can count towards progress measures. This can happen if a student takes
two similar exams or if they retake the same exam in different seasons. There
are examples of both in the sample data.
Even if you know that all your results can count keep
reading as I explain formulas we’ll need again subsequently. If not, then
import the 2019 sheet of the DfE spreadsheet ‘Key stage 4 qualifications and
discount codes: 2014 to 2021 performance tables.xlsx’ using the same procedures
as for the points score table.
It’s possible to sort out discounting in PQ (there’s lots
of overlap between PQ and DAX functions) but we’re going to use DAX as it will
introduce us to some useful formulas. The spice in this meatball is that a single
QAN can have different discount codes depending on the exam option, but that
exam options are only listed where this is the case.
The source data looks like this.

In order to pull this data we use the DAX formula LOOKUPVALUE. This allows us to place a value from one table into another without requiring any relationship to exist between them. Its syntax is:

In order to pull this data we use the DAX formula LOOKUPVALUE. This allows us to place a value from one table into another without requiring any relationship to exist between them. Its syntax is:
LOOKUPVALUE(<result we want>, <field from that
table1>,<matching field from destination table1>,<field from that
table2>,<matching field2>…..<alternative result>)
You can use as many fields as you like to match, but you
either need to provide enough information to identify a single result or supply
an alternative result as the final argument, if not you get an error. We’ll use
that to our advantage by making a calculated column on ExamData with this
formula:
DiscountCode = IFERROR(LOOKUPVALUE('2019'[2019 KS4 Discount
Code],'2019'[Qualification Number],ExamData[QAN]),
LOOKUPVALUE('2019'[2019 KS4 Discount
Code],'2019'[Qualification Number],ExamData[QAN],'2019'[Syllabus Reference],ExamData[ExamCode]))
Row Context and EARLIER
Now we need to check if any kids have multiple results with the same discount code. To do that we need a really useful formula called EARLIER. EARLIER lets us recall the row context from an earlier stage in a calculation.
Say you’re adding a calculated column and you put Column = StudentID. The formula will give the StudentID of each row of the table (we say it’s calculated in the context of that row). But if you want to know how many times each studentID appears then you need to run an aggregation which considers all rows of the table, and counts those where the studentid appears. You would do this with:
CountofStudentID =
COUNTROWS(FILTER(ExamData,[ExamData]StudentID=EARLIER([ExamData]StudentID)))
The calculated column starts with row context, but that is
removed by the aggregation formula which looks at all rows of the table. We can
get it back to use in the filter by specifying that it’s an EARLIER row context. Note that it is
therefore referring to an earlier stage in the calculation, not an earlier
record in the table.
You also need to be clear which discounting rules you’re
going to apply. I’m going to say that if the same exam was retaken I’ll take
the earlier result, but that if the entries are different I’ll take the
highest.
Our discount formula is as follows
Discounted = If(COUNTROWS(FILTER(examdata,ExamData[StudentId]=EARLIER(ExamData[StudentId])&&ExamData[DiscountCode]=EARLIER(ExamData[DiscountCode])&&ExamData[Duplicate]=0))>1,
IF(CALCULATE(DISTINCTCOUNT(ExamData[Season]),FILTER(examdata,ExamData[StudentId]=EARLIER(ExamData[StudentId])&&ExamData[DiscountCode]=EARLIER(ExamData[DiscountCode])&&ExamData[Duplicate]=0))>1,
IF(CALCULATE(min(ExamData[ResultDate]),FILTER(examdata,ExamData[StudentId]=EARLIER(ExamData[StudentId])&&ExamData[DiscountCode]=EARLIER(ExamData[DiscountCode])&&ExamData[Duplicate]=0))=ExamData[ResultDate],0,1),
IF(CALCULATE(min(ExamData[Index]),FILTER(examdata,ExamData[StudentId]=EARLIER(ExamData[StudentId])&&ExamData[DiscountCode]=EARLIER(ExamData[DiscountCode])&&ExamData[Duplicate]=0))=ExamData[Index],0,1)),0)
The first IF statement checks to see if there are more than
one non-duplicated rows for the same student and discount code. If that is true
the second statement checks to see if the results are from multiple seasons, if
that is true the third statement checks to see if the result date equals the
earliest result – if that is true then the value is 0 (not discounted), 1 if
false).
The fourth statement deals with multiple results from the
same season checking to see if they have the lowest index value (ie they are
the highest grade).
Note that this won't handle resits of Combined Science (the non duplicate rows will be discounted but their duplicate 'partner' rows won't be). If you have students who've resat Combined Science in your data you'll need to add an IF condition to consider it separately, checking initially if the number of repeat rows is greater than 2 not 1.
Note that this won't handle resits of Combined Science (the non duplicate rows will be discounted but their duplicate 'partner' rows won't be). If you have students who've resat Combined Science in your data you'll need to add an IF condition to consider it separately, checking initially if the number of repeat rows is greater than 2 not 1.
A8 Table
We now have our discounted results marked with a 1. Rather
than continually filter these out in subsequent measures, our final step is to
go to the Modelling tab, click ‘New Table’ and create the following
A8Data = FILTER(ExamData,ExamData[Discounted]=0)
Finally, remember to create a relationship on the Model View linking A8Data to Students on StudentId.
Finally, remember to create a relationship on the Model View linking A8Data to Students on StudentId.

This table with the sample set has 1235 results for 98 students and we’ll use it as the basis for our A8 measures – see you in part 2!

Comments
Post a Comment