Subject - Class - Pupil Table
One of
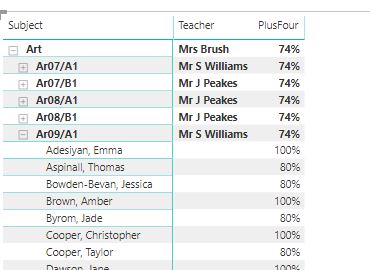
the really powerful features of BI is being able to drill very quickly from the
macro picture to the micro. To help schools do this with assessment results
I've recently been working on this table showing subject, class and pupil level
results (p2 of the report below).
You can download the PBI file here, the class information looks like this

In a
previous post I described concatenating studentid and subject to link classes,
assessments and students, but that's not actually best practice - you can do it
more simply with this setup

I created
the Subjects table using Dax (create table on the modelling tab). The formula
is
Subjects
= DISTINCT(AssessmentResults[Subject]). It gives a one column table with each
distinct value of subject.
Note that
here it is assumed that StudentClasses[Subject] isn't always the same
AssessmentResults[Subject], as for
example English Classes will often have English Literature Results. To handle
this create a calculated column in table Subjects with the formula
CurSubject
= SWITCH(TRUE(),Subjects[Subject]="English
Literature","English",Subjects[Subject])
You can add as many pairs of conditions-results as you like in the
SWITCH expression which is easier than nesting IFs. The final clause means that
if none of the conditions are met the same subject is used.
You then need a similar table with the unique Curriculum Subjects to
create a chain of one to many relationships (many to many won’t work here).
Now that the relationships are sorted we can build the visual. Although
it looks like a table it's actually a Matrix. Add Subjects[Subject],
StudentClasses[ClassName], and Students[FullName]. The +/- icons for expanding
the levels don't appear by default, turn them on by going to the format menu of
the visual, under row headers and selecting them.

The columns of the table are built up by placing Measures in the Values
space of the visual (leave 'Columns' empty)


The Pupils measure counts students
Pupils = DISTINCTCOUNT(StudentClasses[StudentId])
If you expand the table you’ll see every class listed under every subject.
But Pupils will only show counts for classes in the right subject. So in the
visual filters if you drag pupils and set to ‘Is not blank’ the table will show
only the correct rows.
Assessment Measures
4/5/7+ measures work like this:
PlusFour = SUMX(AssessmentResults,if(AssessmentResults[Points]>=4,1,0))/COUNTROWS(AssessmentResults)
APS is simple
AvgPts = AVERAGE(AssessmentResults[Points])
Note that these assume that you will be using slicers to specify which assessment
type (current/predicted etc) and which term/data drop.
The progress/on target measures are slightly more complicated. I created
a separate
Targets table using DAX from AssessmentResults using the formula
Targets table using DAX from AssessmentResults using the formula
Targets = FILTER(AssessmentResults,AssessmentResults[AssessmentType]= “HELM
KS4 Target”)
AvgProg = AVERAGEX(AssessmentResults,
if(isblank(LOOKUPVALUE(Targets[Points],Targets[StudentId],AssessmentResults[StudentId],Targets[Subject],AssessmentResults[Subject],Targets[YearGroup],AssessmentResults[YearGroup],Targets[Term],AssessmentResults[Term])),Blank(),
AssessmentResults[points]-value(LOOKUPVALUE(Targets[Points],Targets[StudentId],AssessmentResults[StudentId],Targets[Subject],AssessmentResults[Subject],Targets[YearGroup],AssessmentResults[YearGroup],Targets[Term],AssessmentResults[Term]))))
The AVERAGEX calculates the mean of the values returned by the
expression for each row of the specified table. First the expression checks to
see if a target ISBLANK. If so null is returned, if not the target is subtracted
from the grade in Assessment Results.
LOOKUPVALUE will return an error unless it resolves to a single result
or an alternate result is given as a last clause (which could be BLANK()).
OnTarget = sumx(AssessmentResults,
IF(AND(NOT ISBLANK( LOOKUPVALUE(Targets[Result],Targets[StudentId],AssessmentResults[StudentId],Targets[Subject],AssessmentResults[Subject],Targets[YearGroup],AssessmentResults[YearGroup],Targets[Term],AssessmentResults[Term])),AssessmentResults[Points]
>=
LOOKUPVALUE(Targets[Points],Targets[StudentId],AssessmentResults[StudentId],Targets[Subject],AssessmentResults[Subject],Targets[YearGroup],AssessmentResults[YearGroup],Targets[Term],AssessmentResults[Term]))
,1,0)/
COUNTROWS(AssessmentResults))
To check for above/below target change the second “>=” in this measure
to “>” or “<”.
Teachers
You could add teachers by simply dragging the ‘Main Teacher’ data item
as a value and selecting ‘First’ as it’s summarisation. This will result in it
appearing in every row though which is annoying to look at, and will also mean
the subject row shows the first teacher alphabetically of that subject, which
is also not ideal.

Fortunately, we can create a measure to sort this for us. What we want
is for the measure to behave differently at different levels of the table hierarchy
and there is a Boolean formula ISINSCOPE that allows us to code this. It’s good
practice to start at the bottom of the hierarchy and work up, so our measure
is:
Teacher =
SWITCH(TRUE(),ISINSCOPE(Students[Fullname]),BLANK(),ISINSCOPE(StudentClasses[ClassName]),FIRSTNONBLANK(StudentClasses[MainTeacher],1),ISINSCOPE(Subjects[Subject]),FIRSTNONBLANK(Subjects[HOD],1))
Note that we need to use the fields that are used in the visual – so Subjects[subject]
not StudentClasses[Subject].
I used this formula to manually put in two HOD names – obviously you
could draw them from a datasource and refer to a related column instead.
HOD = SWITCH(Subjects[CurSubject],"ART","Mrs
Brush","English","Ms Pen",BLANK())
Note that we have to use FIRSTNONBLANK because otherwise the measure
wouldn’t know which value in the column to display. We know that in both cases
they’ll just be one so we specify we want the first one.
The table now looks like this
MAT Vision Classes and Teachers
The treatment of subjects, classes and teachers in the
Bromcom MAT Vision database is slightly more sophisticated. Both are classified
as ‘Collections’. CollectionAssociates lists student memberships of
collections. Collection Executives list teacher responsibility for classes/subject.
Collection Hierarchies lists the nesting of collections – e.g. classes belonging
to a subject.
The tables and relationships for a class results table in a
MAT Vision build look like this:

xASMFilter – contains filtered assessment results (just the
assessment types I wanted and current year as that loads faster than all
assessment results). Linked to xStudents on SchoolStudentId and zASMSubjects on
subject.
xASMSubjects – the unique list of assessment subjects (as
above)
xCurSubjectfix – unique curriculum subjects.
xCurrSubjects – filtered Collections with type subject. Links
to xHierarchies on SchoolCollectionid to SchoolParentId (which I had to make,
concatenating VisionId and ParentId)
xHierarchies =
collectionhierarchies. Links to xClasses on SchoolCollectionId
xClasses – filtered Collection with type Teaching Group.
Links to memberships on schoolstudentid and xExecutives on SchoolCollectionId
xExecutives = collectionexecutives
xMemberships = filtered CollectionAssociates to show active
memberships only.
As Executives has all teachers of a class not just the main I used a modified version of the measure to show the Main Teacher first, the name of the other teacher if shared with one other person and ‘Et al’ if shared with two or more:
Teachers = CALCULATE(FIRSTNONBLANK(xStaff[StaffName],1),xExecutives[CollectionRoleTypeDescription]="Main Teacher") &
if(countrows(filter(xExecutives,xExecutives[CollectionRoleTypeDescription]="Teacher"))=0,BLANK(),
if(countrows(filter(xExecutives,xExecutives[CollectionRoleTypeDescription]="Teacher"))=1,
CONCATENATE(" & ", CALCULATE(FIRSTNONBLANK(xStaff[StaffName],1),xExecutives[CollectionRoleTypeDescription]="Teacher")),
" et al"))


Impressive! Thank you, this has given me some inspiration. We've done similar tables but using power query to do the donkey work, finished off with Dax, but I like this approach.
ReplyDeleteThanks! I've tended to steer clear of Power Query because anecdotally i hear the performance is worse than DAX but if you come across a task it does really well then let me know.
ReplyDeleteps. Note that in the above SELECTEDVALUE is a better substitute for FIRSTNONBLANK