Static Data Tables and Sorting Year Groups
It's often useful to have static data tables in your BI model (one recent example for me is converting ethnicity codes to census categories) and I've been through a process of trial and error to find the best way of doing this.
(Wondering why not an Excel 365 file as it's MICROSOFT Power BI? Hahahaha - you work it out then tell me how please ;)

Here the obvious solution - a calculated column assigning a numerical value to each year with IF statements - doesn't work because BI won't let you sort column A by column B if B's values are calculated from A's.
Instead create a table with year group names and their order number. With syntax like:


Import from Excel/CSV
This is the most obvious: Get Data, Excel, Bosh! But unless you're only going to update your data from PBI Desktop it's not a good idea. If you have Excel/CSV data sources in the file then you can't schedule refresh from app.powerbi.com.
(you can if you set up a "gateway" and turn your machine into a server but, trust me, this isn't worth it)
Google Sheet
Next option is a Google Sheet and note that it must be a Google sheet, not simply an xlsx uploaded to Drive.
(Wondering why not an Excel 365 file as it's MICROSOFT Power BI? Hahahaha - you work it out then tell me how please ;)
To connect that to BI:
Hit the share button top right hand side of the screen and edit the link that looks like this:
https://docs.google.com/spreadsheets/d/1qbEJU_gbBvSEsO6DorxXE0eEc1_09jGBvdHI418lmqQ/edit?usp=sharing
So that it looks like this:
https://docs.google.com/spreadsheets/d/1qbEJU_gbBvSEsO6DorxXE0eEc1_09jGBvdHI418lmqQ/export?format=xlsx&id=1qbEJU_gbBvSEsO6DorxXE0eEc1_09jGBvdHI418lmqQ
Get Data in BI, choose 'Web' and paste the link. Full details in an earlier post here
Get Data in BI, choose 'Web' and paste the link. Full details in an earlier post here
When you schedule refresh you just tell the service that it's an anonymous connection. Obviously this is only suitable for information that's in the public domain as there's no security.
The advantage of this approach is that it's easy and can handle big lookup tables no problem.
The disadvantage is that you have to maintain the Google sheet as your PBI file refers to it. A few months down the line you might tidy up your Drive and accidentally break a load of your dashboards.
Enter Data
You can just enter data into a new table using 'Enter Data' on the home tab. Once you've done that it's actually quite tricky to edit though and to control the data types so I prefer...
Enter Data
You can just enter data into a new table using 'Enter Data' on the home tab. Once you've done that it's actually quite tricky to edit though and to control the data types so I prefer...
New Table with DATATABLE Function
You can make a table from pure DAX using the DATATABLE Function. This way you define the columns and data types then the data they contain with the syntax:
DATATABLE (ColumnName1, DataType1, ColumnName2, DataType2..., {{Value1, Value2...}, {ValueN, ValueN+1...}...})
To make a new table Choose 'New Table' from the Modelling tab and enter the code in the formula bar.
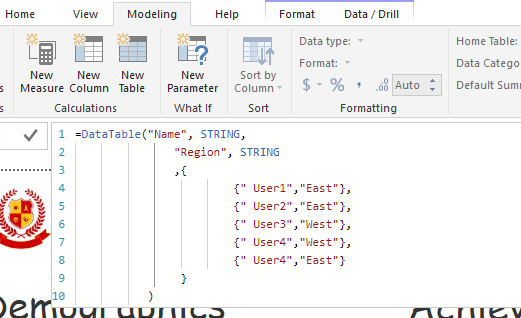
Pro tip: copy the Example formula from the function reference and adapt it
The advantage of this approach is that it's the most robust as the data is contained entirely within the file. The disadvantage is that it's impractical for large tables.
Sorting year groups
A DATATABLE table can help you solve a common but tricky problem: year groups showing in the wrong order because the data is stored as a string.
 |
| Yuck! |
Instead create a table with year group names and their order number. With syntax like:
YearSort = DataTable("YearName", STRING,
"Order", INTEGER
,{
{"N1",-2},
{"N2",-1},
{"R",0},
{"1",1},
{"2",2},
{"3",3},
{"4",4},
{"5",5},
{"6",6}
}
)
Note that the Year Names are in quote marks even when they are numbers because their data type is String. The Order values are numeric so are not enclosed in quotes.
Pro tip: Use Shift+Enter to create a new line of DAX code for clarity and ease of editing
Now create a relationship between Students[YearGroup] and YearSort[YearName]
Then create a calculated column on table Students:
YearSortOrder = RELATED(YearSort[Order])
Now you can go to the data view of table students, highlight YearGroup and choose Sort By Column from the modelling tab and choose YearSortOrder.

The default sort for years in all visuals will now be correct.


Comments
Post a Comment